
Quick Summary
Trading with Stochastic indicator involves the following signals:
Details
The idea behind Stochastic indicator
The main idea behind Stochastic indicator according to its developer, George Lane, lies in the fact that rising price tends to close near its previous highs, and falling price tends to close near its previous lows.
How to interpret Stochastic indicator
How to trade with Stochastic indicator
Let’s look at three methods of trading with Stochastic indicator.
Method 1. Trading Stochastic lines crossover
Stochastic lines crossovers that happen above 80% level and below 20% level are treated as strongest signals, compare to crossovers outside those levels.
Traders may choose sensitivity of their Stochastics. The smaller the Stochastic parameters, the faster it will react to market changes, the more crossovers will be shown.
Sensitive Stochastic (for example 5, 3, 3) is useful for observing rapidly changing market trends. But because it is too choppy it should be traded in combination with other indicators to filter out Stochastic signals.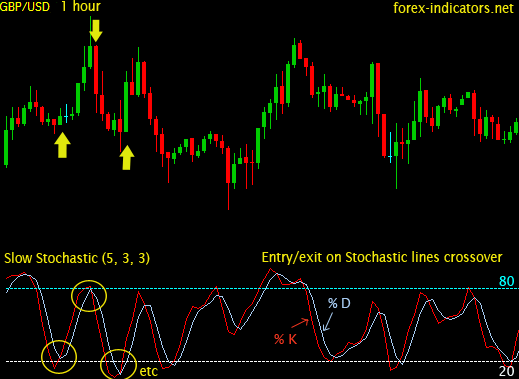
 Method 2. Trading Stochastic oversold/overbought zones
Stochastic by default has 80% level, above which market is treated as overbought, and 20% level, below which market is considered oversold.
It is important to remember that while in sideways moving market a single Stochastic lines crossover that occur above 80% or below 20% will most of the time result in a fast predictable trend change, in trending market could mean just nothing. When price is trending well, Stochastic lines may easily remain in overbought/oversold zone for a long period of time while crossing there multiple times.
That’s why a method of trading overbought/oversold zones stands up. The rules here are to wait until Stochastic lines after being in overbought/oversold zone come out from it. E.g. When stochastic was trading for some time in overbought zone – above 80% level, traders wait for the lines to slide down and eventually cross 80% level downwards before considering to take Short positions. Opposite for Long positions: wait till Stochastic lines come into the oversold zone (below 20% level); wait further until Stochastic lines eventually cross 20% level upwards; initiate a buy order once Stochastic lines are firmly set, e.g. a trading bar is closed and Stochastic lines cross over 20% mark is fixed.Method 3. Trading Stochastic divergence
Traders are looking for a divergence between Stochastic and the price itself. At times when the price is making new lows while Stochastic produces higher lows creates dissonance in the picture. It is called divergence. Divergence between price and Stochastic readings suggest a forming weakness of a main trend and therefore its possible correction.
No comments:
Post a Comment